Navigation · 6 min · Ingrid Vaage, expedition leader
How we read an ice chart at 05:00
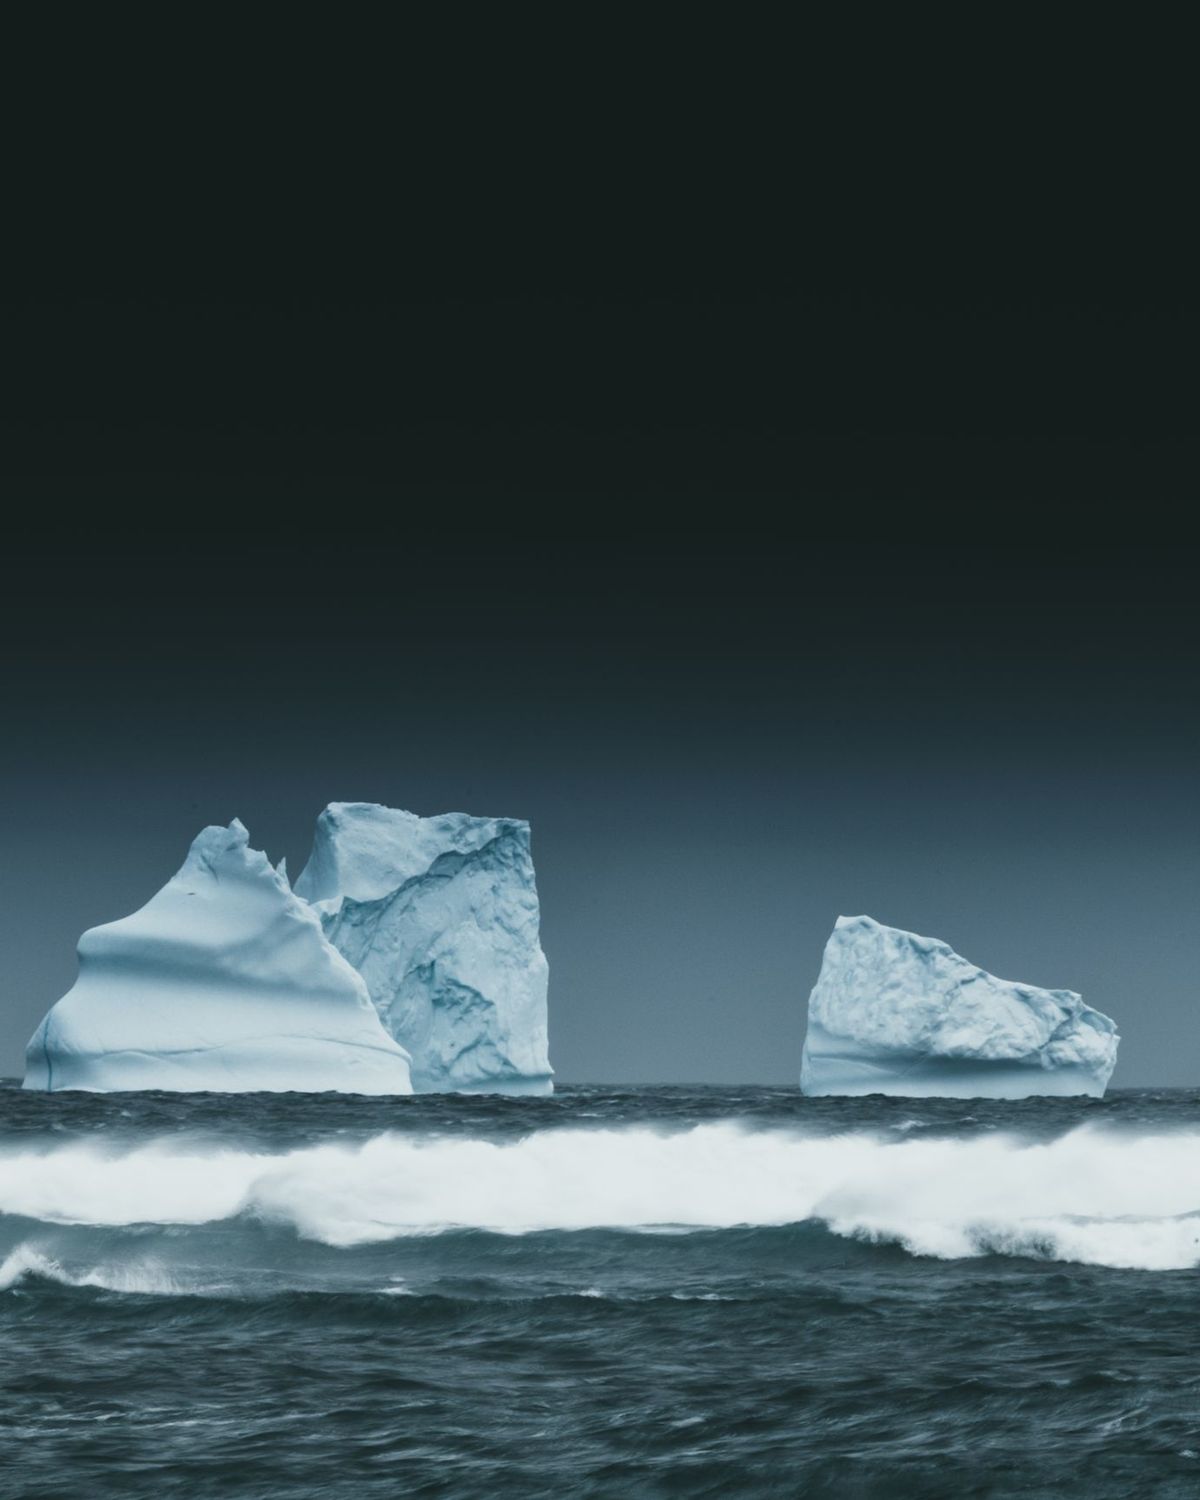
The chart arrives at 04:30 from the national ice services. It is a map of coloured polygons, each with an "egg code": how much of the sea is covered, by what thickness, in floes of what size. A 9/10 cover of first-year ice is a wall for us; 3/10 of brash is a garden.
At 05:00 the captain, the ice pilot and I meet on the bridge with coffee and that chart, the wind forecast, and what the other ships saw yesterday. We pick the landing that will still be open at 09:00, not the one that is open now. Then we write it on the board in the lounge, in pencil.
About one plan in four changes before breakfast. That is not a failure. It is the expedition.
Wildlife · 4 min · Tomás Arrieta, marine biologist
Why gentoos are moving south
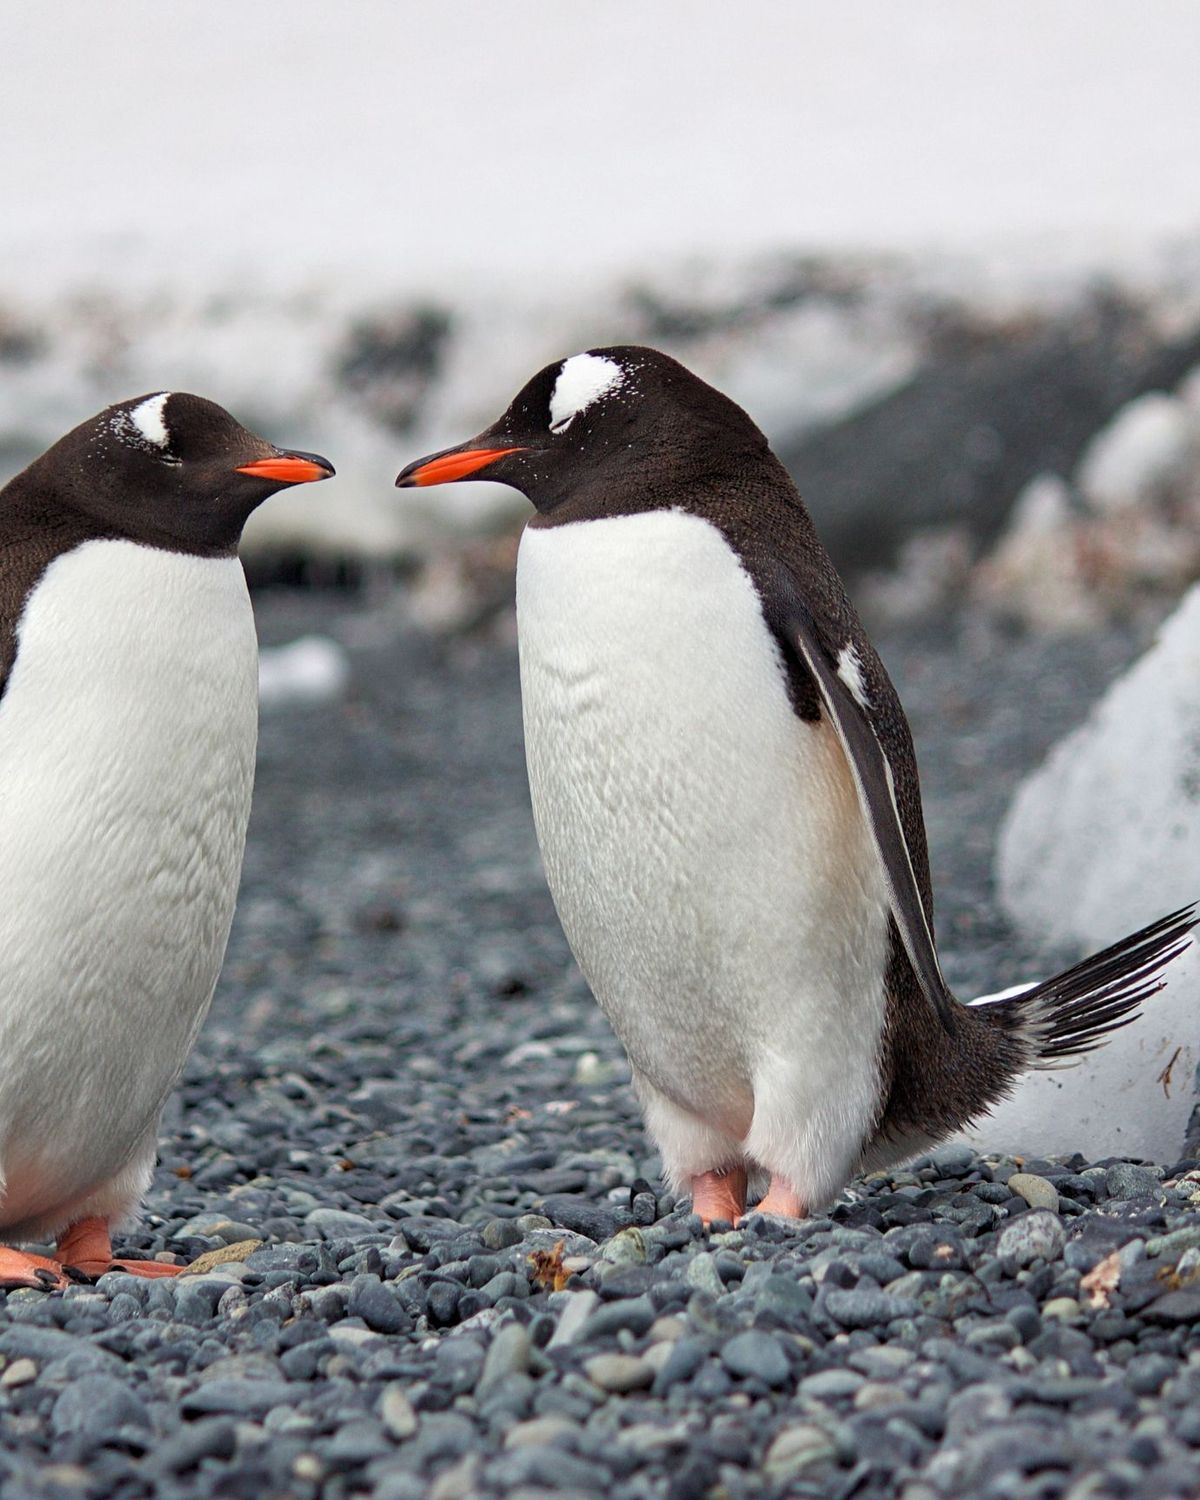
Every season since 2019 our guests have counted the nests at Cuverville Island with us, from the same six points, on the same week of January. Gentoos are up 11% over that time. Adélies further north are down.
Gentoos are generalists: they eat krill, fish, squid, whatever is there. Adélies need sea ice. As the ice edge moves south, so do the penguins that can live without it. Our counts go to the Penguin Watch and MAPPPD databases, where scientists can use them.
Night sky · 5 min · Kalaaleq Petersen, Arctic guide
The first dark night of September
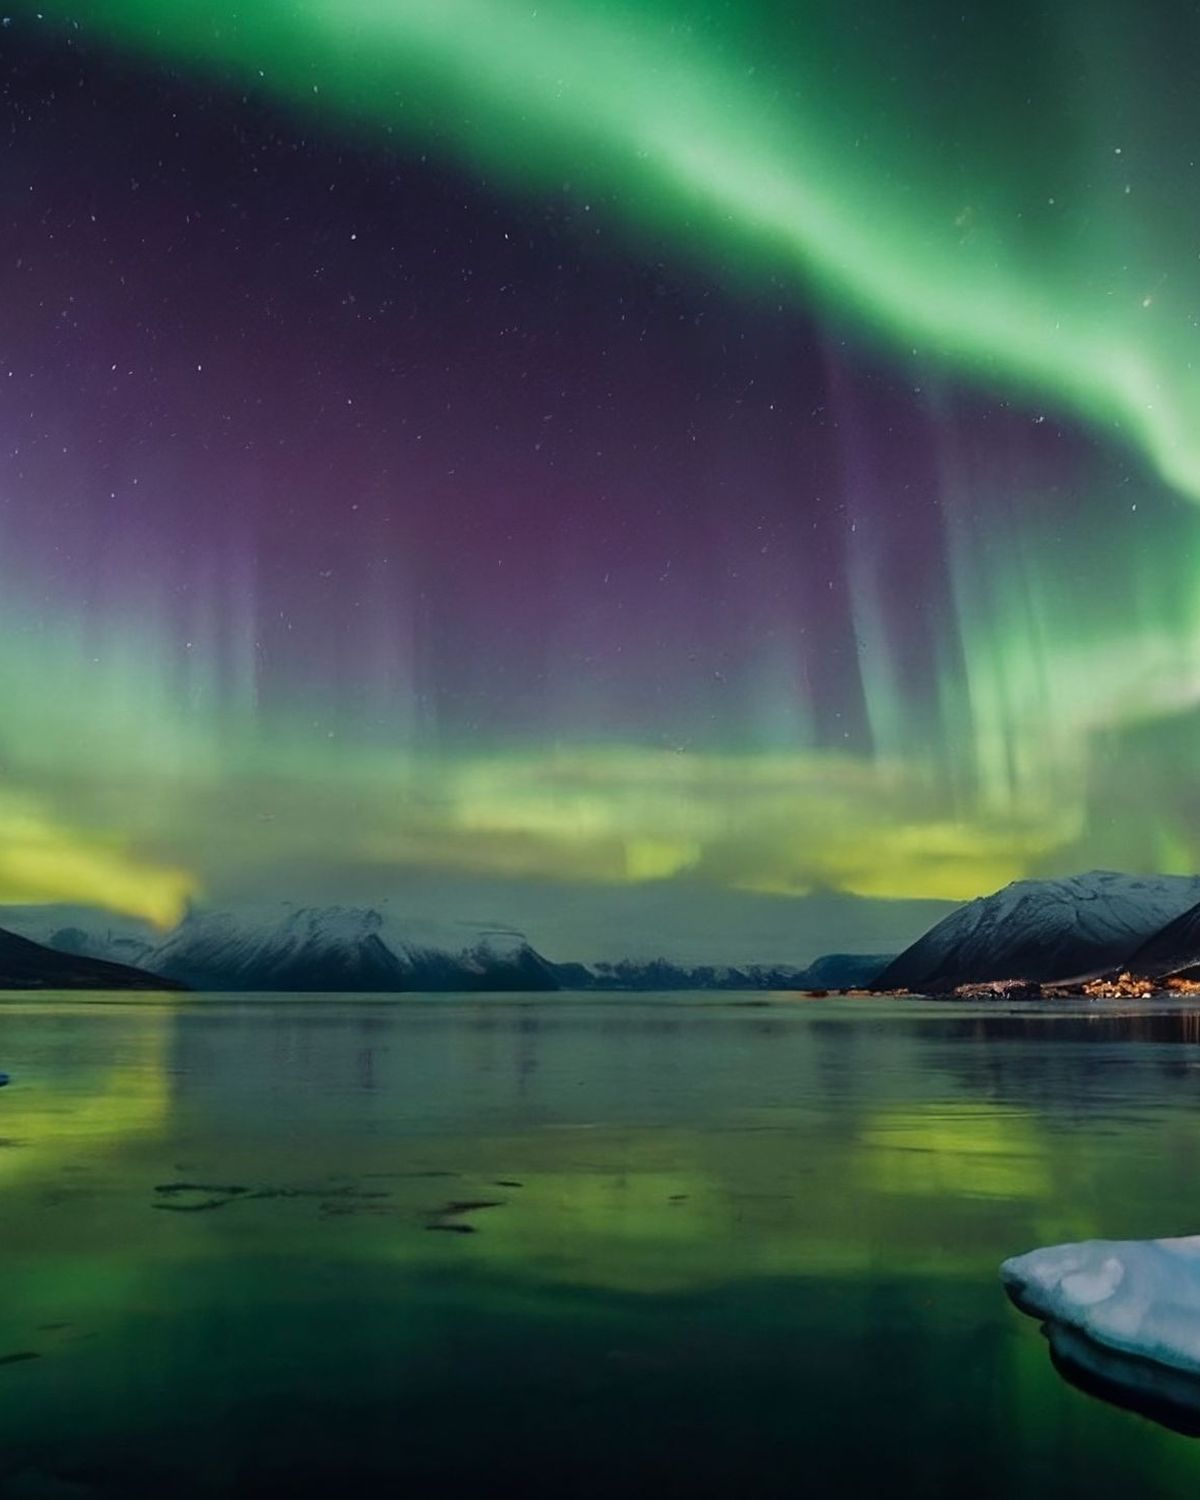
From May to early August the sun does not set over Disko Bay. Then, in about three weeks, the nights come back: one hour of real dark on 20 August, five hours by 5 September.
The bridge keeps a list. If you want to be woken for the aurora, sign it. The officer of the watch calls your suite when the Kp index is above 3 and the sky is clear, at any hour. Most guests sign. Nobody has ever complained.
Credits
Photo and film credits
All photographs and films on this site are from Pexels, used under the Pexels licence. Map data: Natural Earth, public domain. Polynya and Sterna are fictional; prices, dates and statistics are examples.